Illustrations
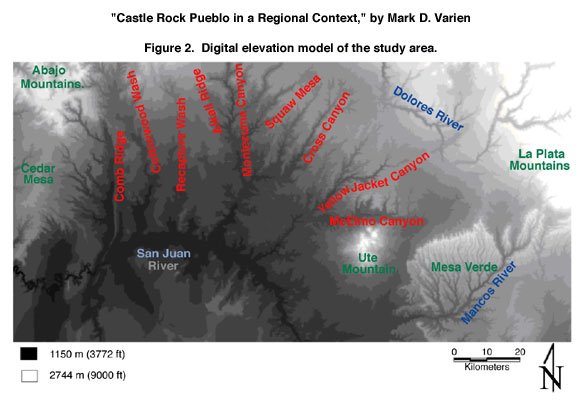
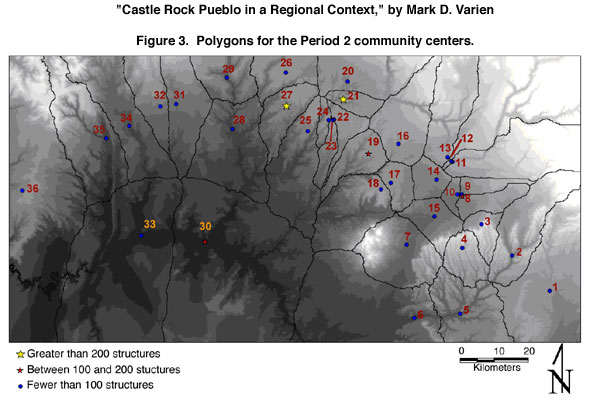
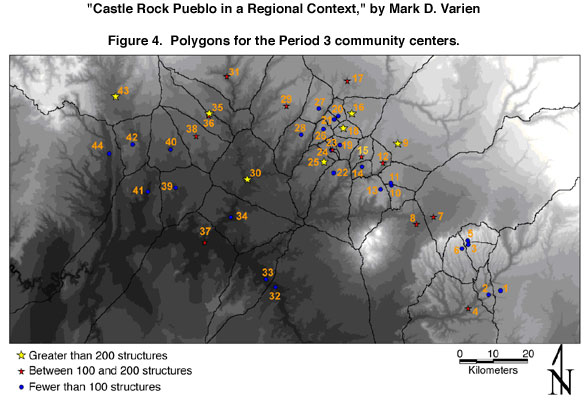
"Castle Rock Pueblo in a Regional Context," by Mark D. Varien
Figure 1. The Sand
Canyon Pueblo locality showing survey areas, and the locations of tested
sites, Sand Canyon Pueblo, Goodman Point Pueblo, and Castle Rock Pueblo.
Figure 2. Digital
elevation model of the study area.
Figure 3. Polygons
for the Period 2 community centers.
Figure 4. Polygons
for the Period 3 community centers.
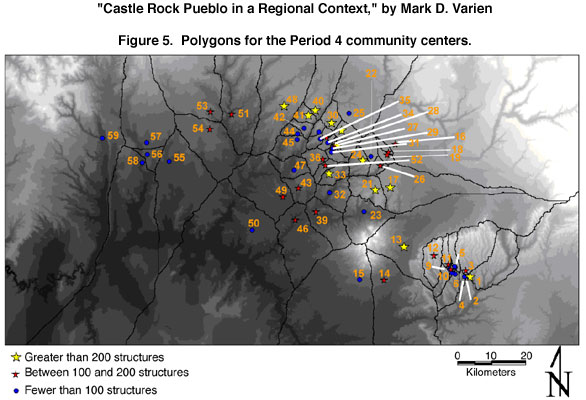
Figure 5. Polygons
for the Period 4 community centers.
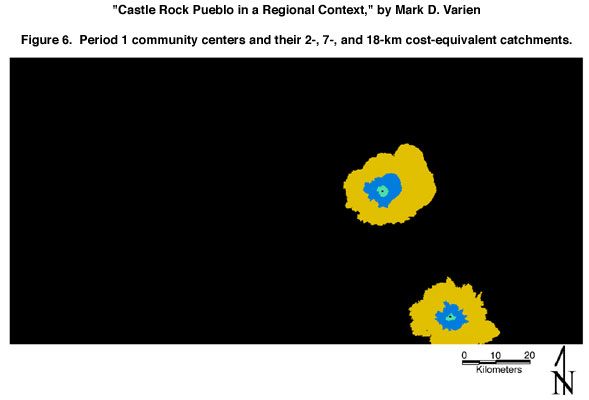
Figure 6. Period 1
community centers and their 2-, 7-, and 18-km cost-equivalent catchments.
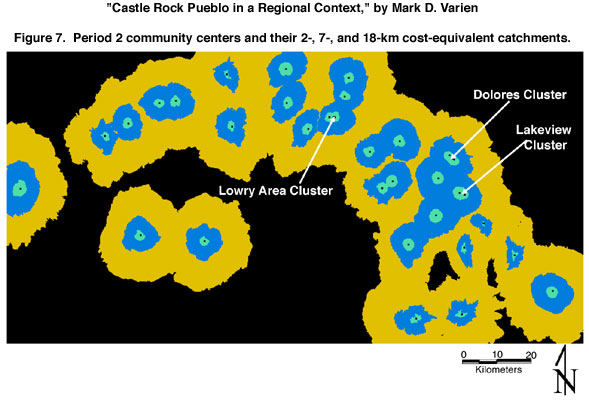
Figure 7. Period 2
community centers and their 2-, 7-, and 18-km cost-equivalent catchments.
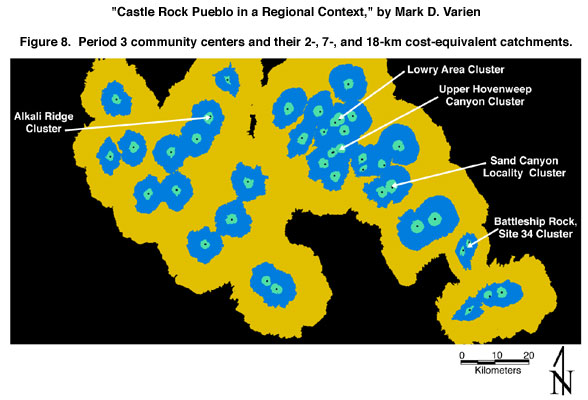
Figure 8. Period 3
community centers and their 2-, 7-, and 18-km cost-equivalent catchments.
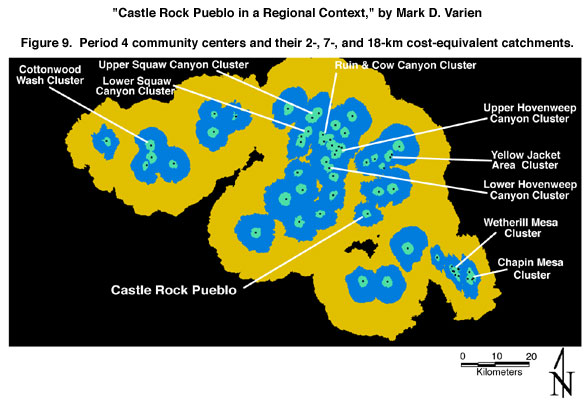
Figure 9. Period 4
community centers and their 2-, 7-, and 18-km cost-equivalent catchments.
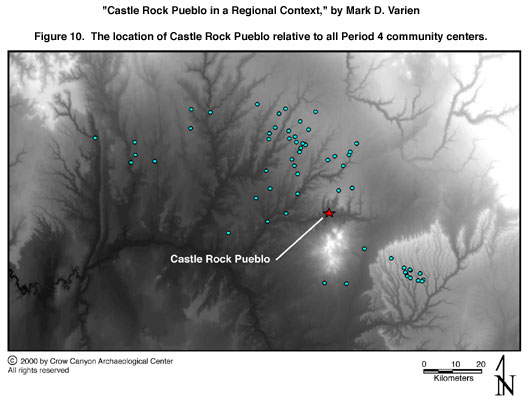
Figure 10. The
location of Castle Rock Pueblo relative to all Period 4 community centers.
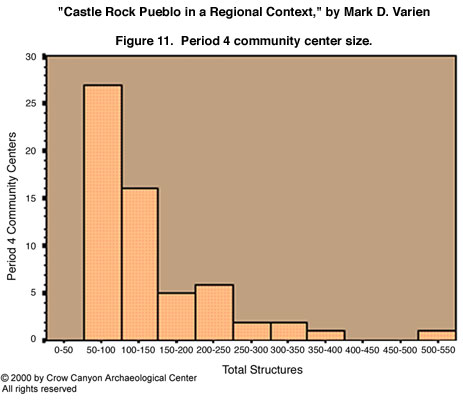
Figure 11. Period 4
community center size.
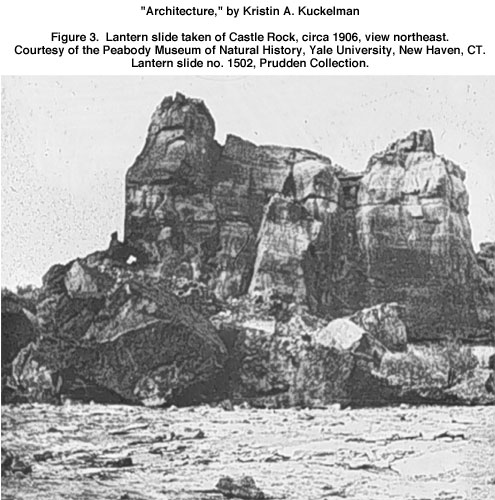
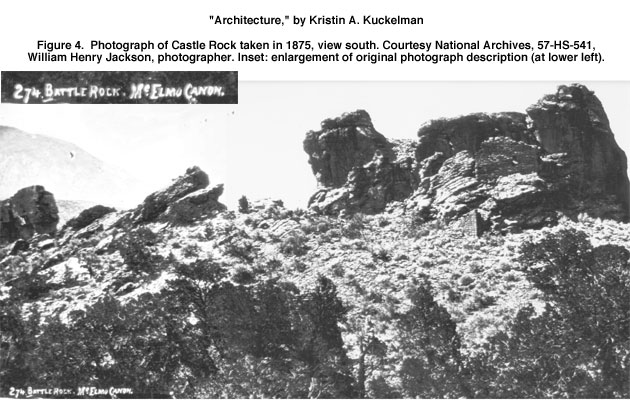
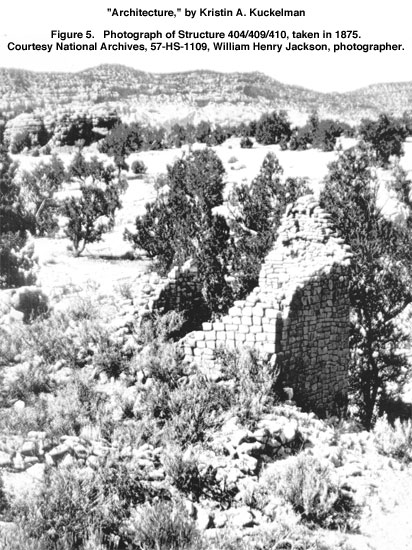
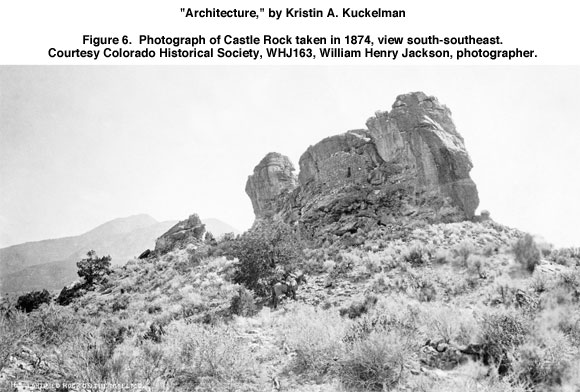
"Architecture," by Kristin A. Kuckelman
Figure 1. Photograph of
Castle Rock taken in 1874, view northeast.
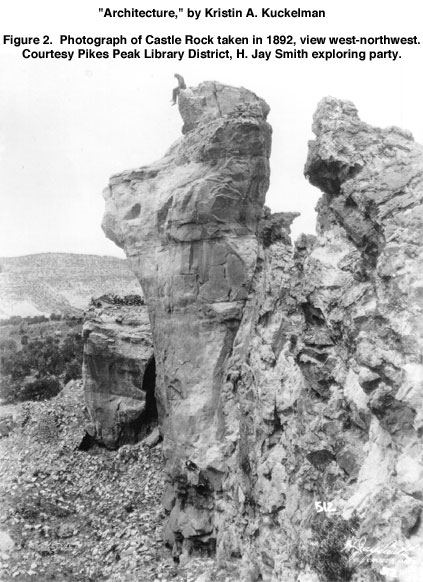
Figure 2. Photograph of
Castle Rock taken in 1892, view west-northwest.
Figure 3. Lantern slide
taken of Castle Rock, circa 1906, view northeast.
Figure 4. Photograph of
Castle Rock taken in 1875, view south.
Figure 5. Photograph of
Structure 404/409/410, taken in 1875.
Figure 6. Photograph of
Castle Rock taken in 1874, view south-southeast.
"Settlement Organization," by
Kristin A. Kuckelman
Figure 1. Photograph of
Castle Rock taken in 1875, view south-southeast.
"Artifacts," by Scott G. Ortman
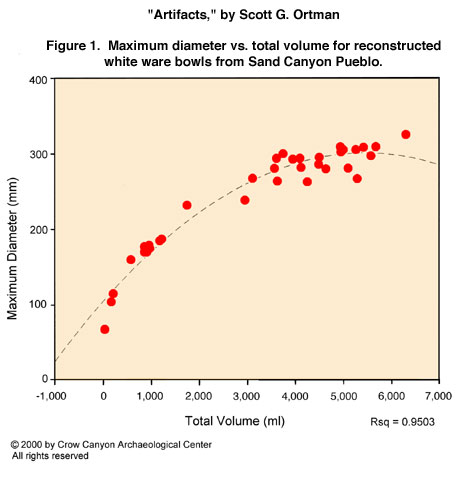
Figure 1. Maximum diameter
vs. total volume for reconstructed white ware bowls from Sand Canyon
Pueblo.
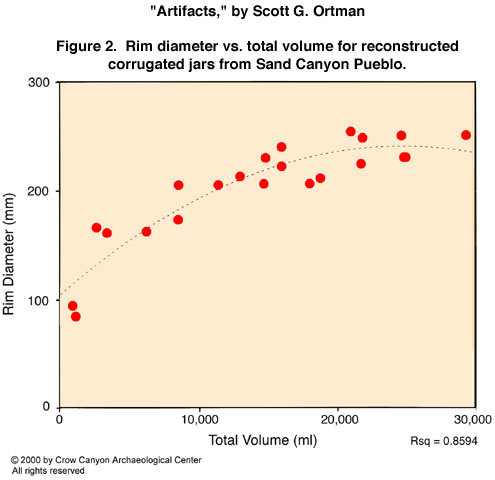
Figure 2. Rim diameter vs.
total volume for reconstructed corrugated jars from Sand Canyon Pueblo.
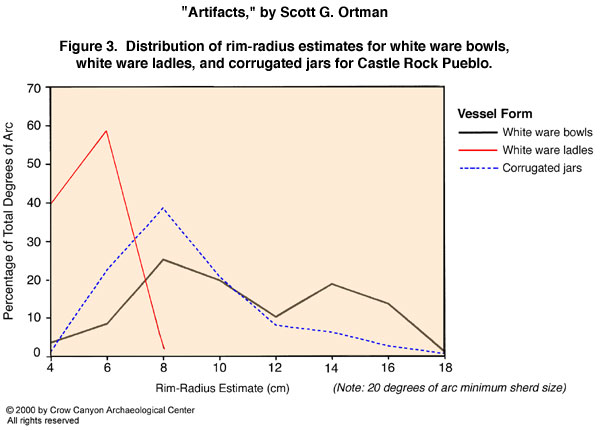
Figure 3. Distribution of
rim-radius estimates for white ware bowls, white ware ladles, and
corrugated jars for Castle Rock Pueblo.
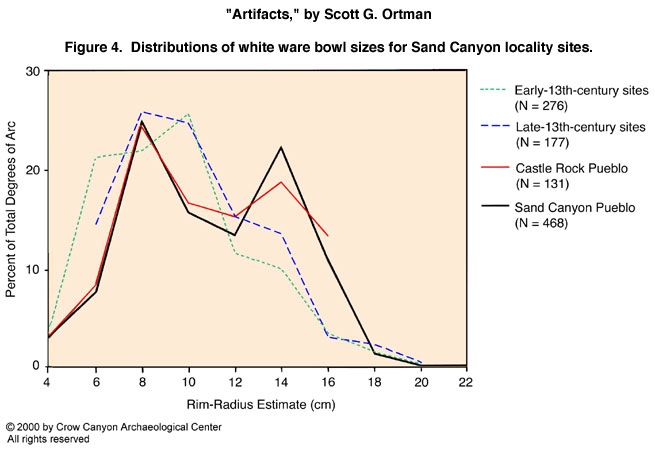
Figure 4. Distributions of
white ware bowl sizes for Sand Canyon locality sites.
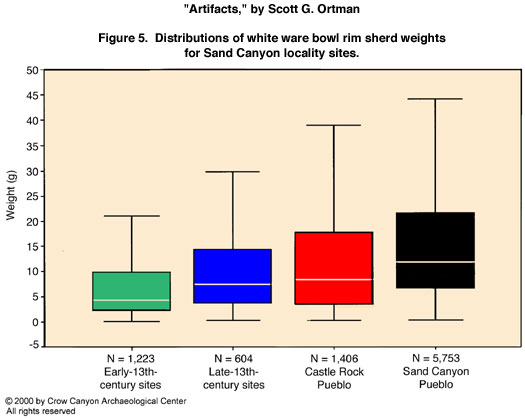
Figure 5. Distributions of
white ware bowl rim sherd weights for Sand Canyon locality sites.
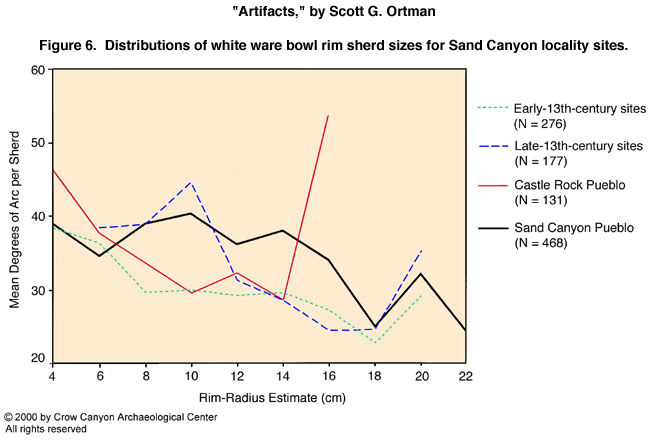
Figure 6. Distributions of
white ware bowl rim sherd sizes for Sand Canyon locality sites.
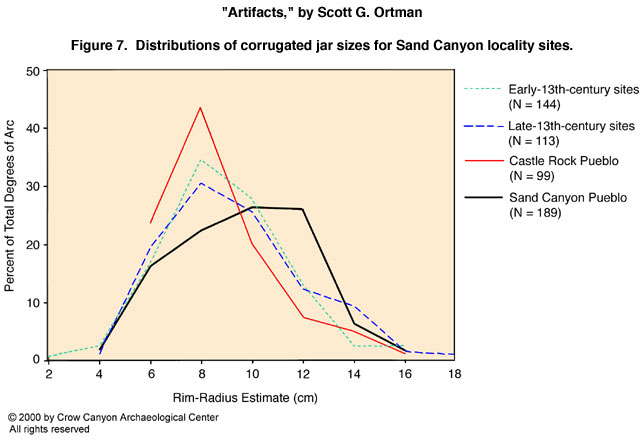
Figure 7. Distributions of
corrugated jar sizes for Sand Canyon locality sites.
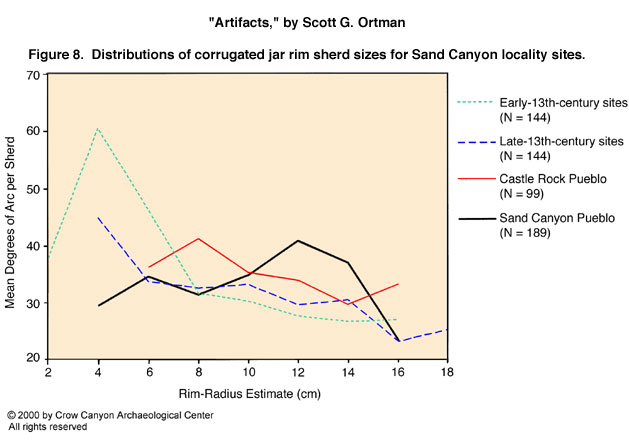
Figure 8. Distributions of
corrugated jar rim sherd sizes for Sand Canyon locality sites.
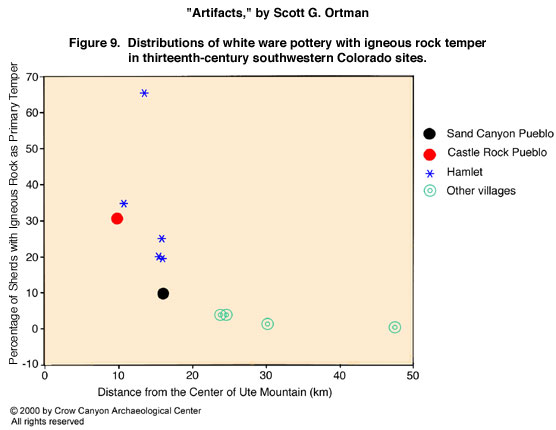
Figure 9. Distributions of
white ware pottery with igneous rock temper in thirteenth-century
southwestern Colorado sites.
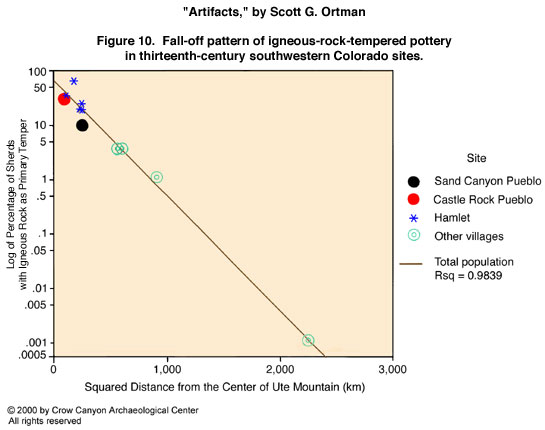
Figure 10. Fall-off pattern
of igneous-rock-tempered pottery in thirteenth-century southwestern
Colorado sites.
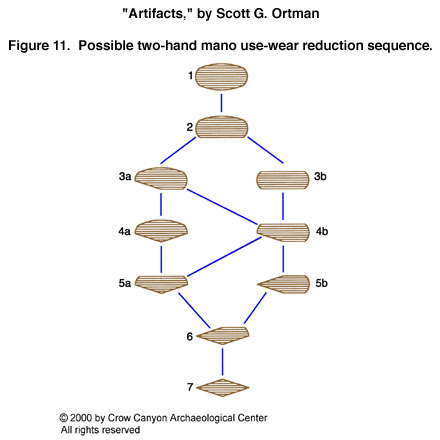
Figure 11. Possible
two-hand mano use-wear reduction sequence.
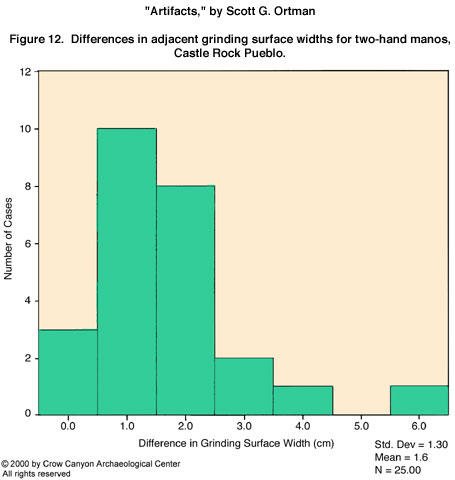
Figure 12. Differences in
adjacent grinding surface widths for two-hand manos, Castle Rock Pueblo.
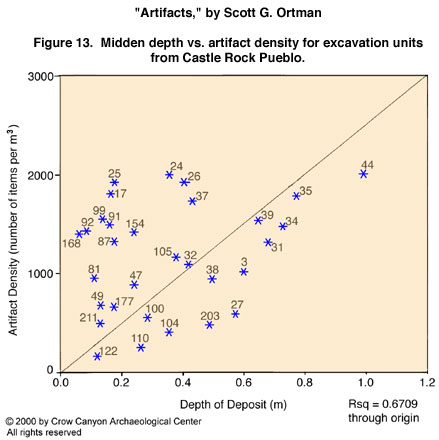
Figure 13. Midden depth vs.
artifact density for excavation units from Castle Rock Pueblo.
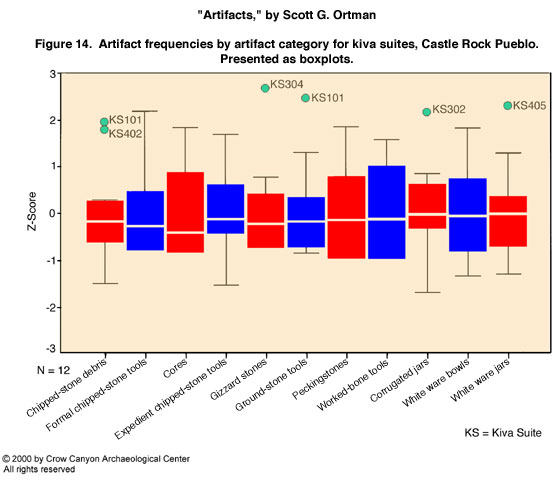
Figure 14. Artifact
frequencies by artifact category for kiva suites, Castle Rock Pueblo.
Presented as boxplots.
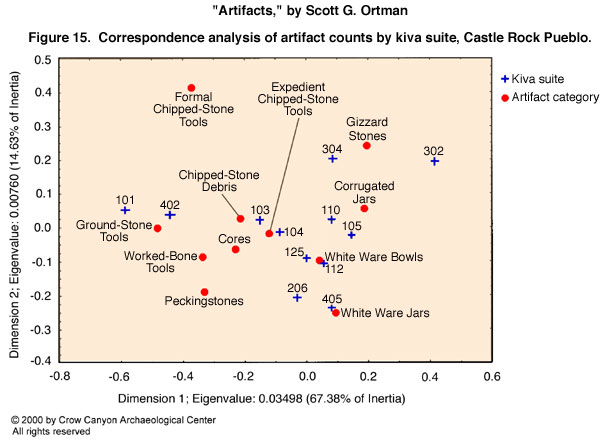
Figure 15. Correspondence
analysis of artifact counts by kiva suite, Castle Rock Pueblo.
Figure 16. Artifact
densities in kiva fills, Castle Rock Pueblo.
"Rock Art," by Kristin A. Kuckelman
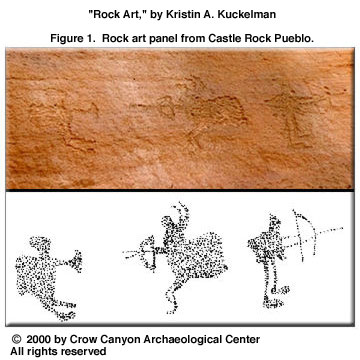
Figure 1. Rock art panel from
Castle Rock Pueblo.
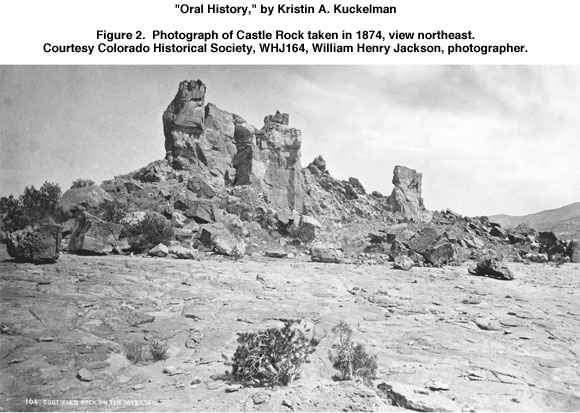
"Oral History," by Kristin A. Kuckelman
Figure 1. Photograph of
Castle Rock taken in 1874, view south-southeast.
Figure 2. Photograph of
Castle Rock taken in 1874, view northeast.
Figure 3. Photograph of
Structure 404/409/410, taken in 1875.
Figure 4. Photograph of
Castle Rock taken in 1875, view south.
Copyright © 2000 by Crow Canyon Archaeological Center. All rights reserved.